Technology
Load testing with Jmeter: an introduction
Today we’re going to go from 0 to a configurable load testing script using JMeter, a free and popular load testing tool. We’ll be moving quickly, so hold on tight.
What is load testing?
If your app or service is very successful, hundreds of people might be using it at once. Lots of things can go wrong when a server is under heavy usage like that. It’s not economical to recruit hundreds of actual people to test your app manually, so your best choice is to use software to simulate it. That’s called load testing or stress testing.
Load testing isn’t the same as end-to-end (e2e) testing. End-to-end testing usually simulates a single user and includes both client-side (front end) and server-side (back end) functionality. Load testing is mostly concerned with server-side functionality; client-side functionality is distributed among all the users’ computers, so it will generally only have one user at a time. Load testing is meant to simulate many users at a time.
Introduction to JMeter
Apache JMeter is a free load testing tool developed by the Apache Software Foundation. You can download it from their website. It’s made with Java, so you’ll need to have Java (version 8 or above) installed on your computer before you begin.
Getting started
Download and unzip the latest JMeter binary from the link above. If you’ll be committing it to source control, I recommend adding docs/ and printable_docs/ to your .gitignore file—they’re huge and you don’t need them to run the app.
For this tutorial we’ll be using the following folder structure:
Load Testing Quickstart/
| config/
| jmeter-5.2.1/
| plans/
jmeter-5.2.1 is the folder you just unzipped. config/ and plans/ are new folders that we’ll be using in a moment.
JMeter has two modes: GUI mode (a graphical interface for setting up and debugging tests) and CLI mode (a text interface for running tests). We’ll start in GUI mode. Look in the jmeter-5.2.1/bin/ directory. If you’re on Windows, run jmeter.bat. If you’re on Linux, run jmeter. A shell window will pop open, followed by the GUI.
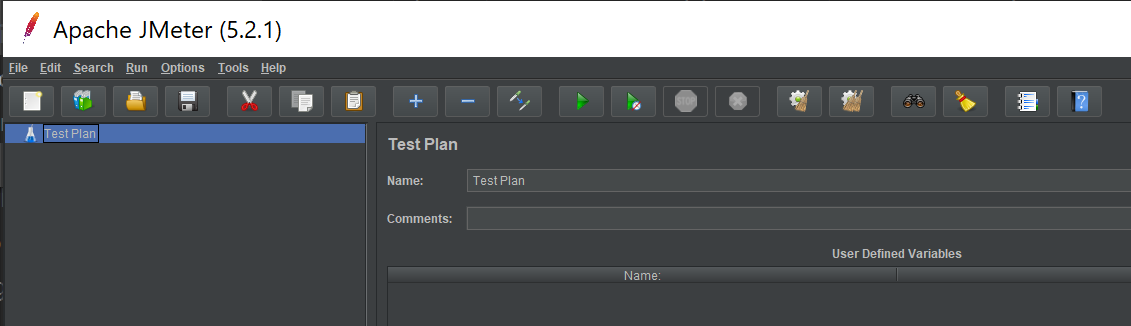
Now you’re ready to start building your test. Click the Save icon (or File > Save Test Plan As) and save to your plans/ folder (I named mine ferb.jmx). Your test plan will be saved as an XML file with the extension .jmx.
Your first test
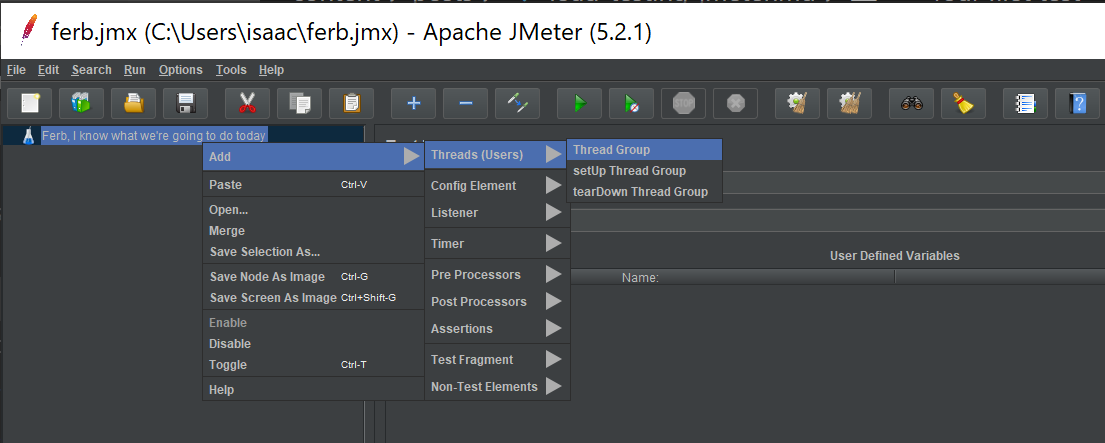
Rename your test plan using the “Name” box on the right. Then right click the beaker on the left side, and choose Add > Threads > Thread Group.
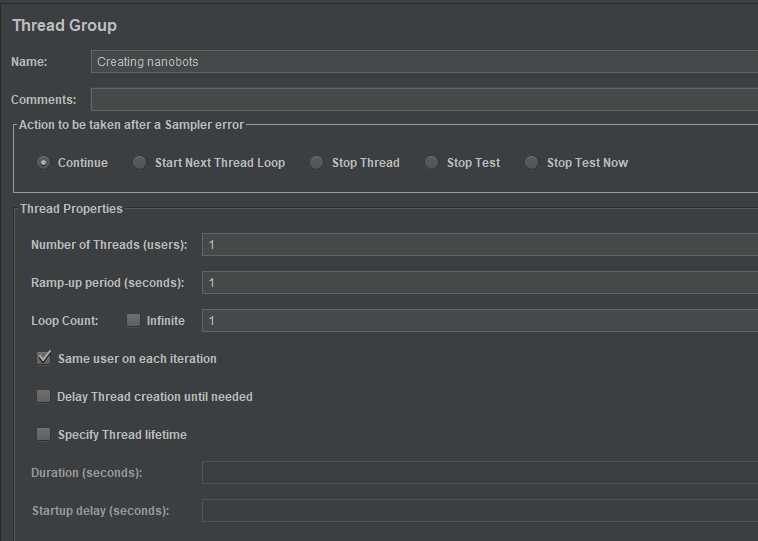
In JMeter, a thread is a simulated user, and a thread group is a set of instructions for all your simulated users to follow. If you click on your new thread group, you can rename it and set up its parameters. You could have a test with 1000 users that runs once, or a test with 50 users that loops for 120 seconds, or a test with a million users that loops twice. For now, set Threads to 1, set Loop Count to 1, and uncheck the “Specify Thread Lifetime” box (these may already be the default settings).
You may have noticed there were three types of thread groups. A setUp Thread Group is a special set of instructions for setting up your test–you could use it to get auth tokens or send an API request to seed a database. A tearDown Thread Group is for cleaning up after your test. Usually these will just have one thread. A regular Thread Group will usually have multiple threads and will be the main body of your test.
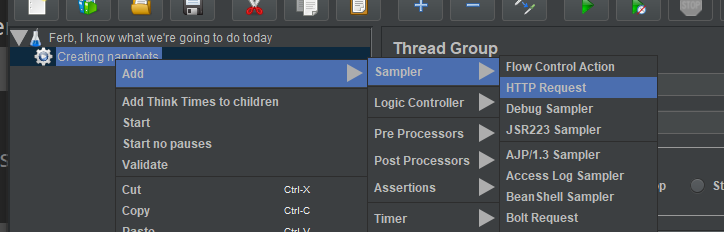
For this test, we’re going to submit one HTTP request and check the results. Right-click your thread group on the left side and click Add > Sampler > HTTP Request.
On the right side, enter https as the Protocol, jsonplaceholder.typicode.com as the Server, and leave Port empty. Set Method to GET and enter /posts/1 as the Path. This means we’re going to send a GET request to https://jsonplaceholder.typicode.com/posts/1. We’re all set, but before we run this test, let’s add one more thing. Right-click your Thread Group on the left side and choose Add > Listener > View Results Tree.
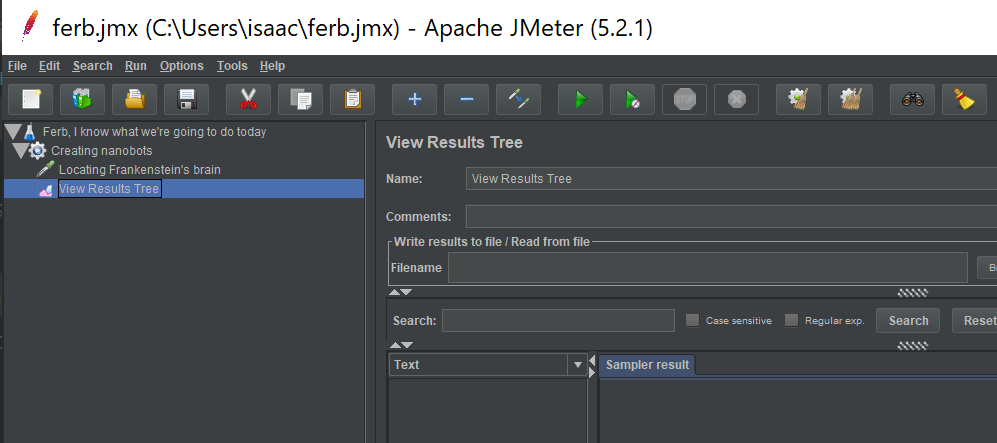
The View Results Tree block will show you what’s happening at each step of your test. Now click the green Play button on the command ribbon, or select Run > Start from the top menu. The timer at the top right corner will start counting, and when it stops, you should see something like this in your Results Tree:
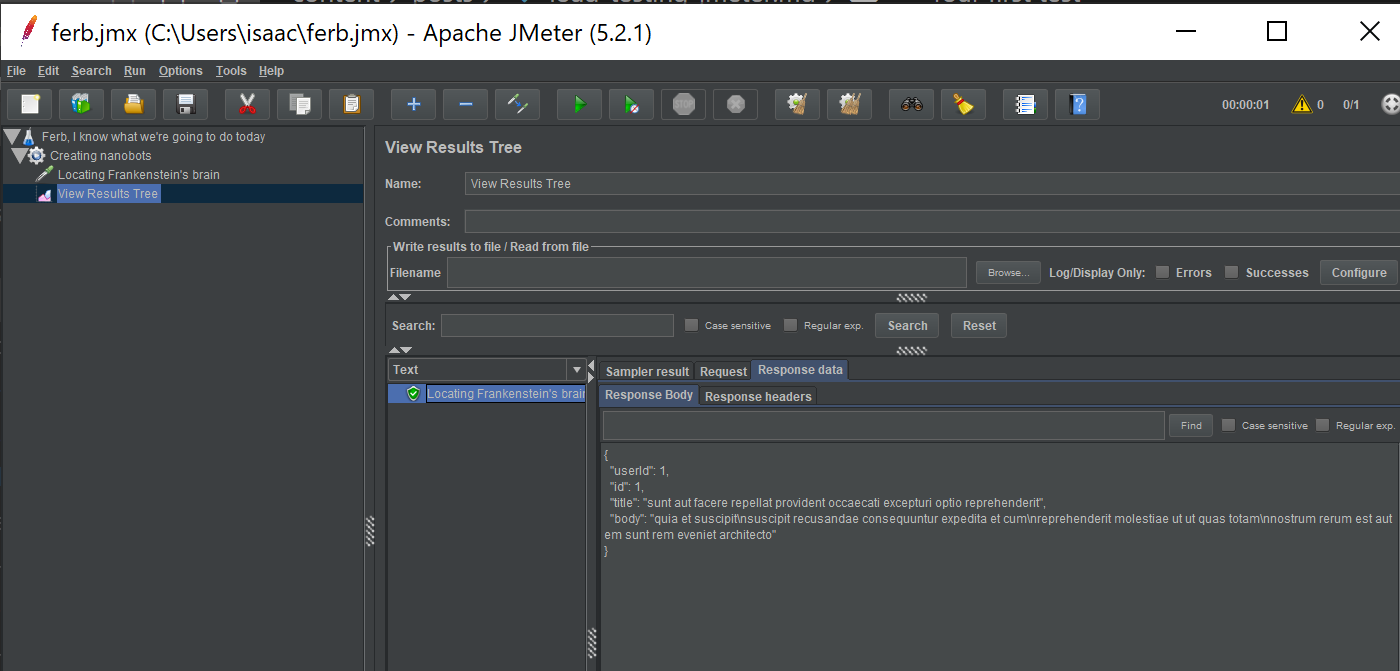
Cool! You sent an HTTP request and got a JSON response. Let’s add an assertion to check the result.
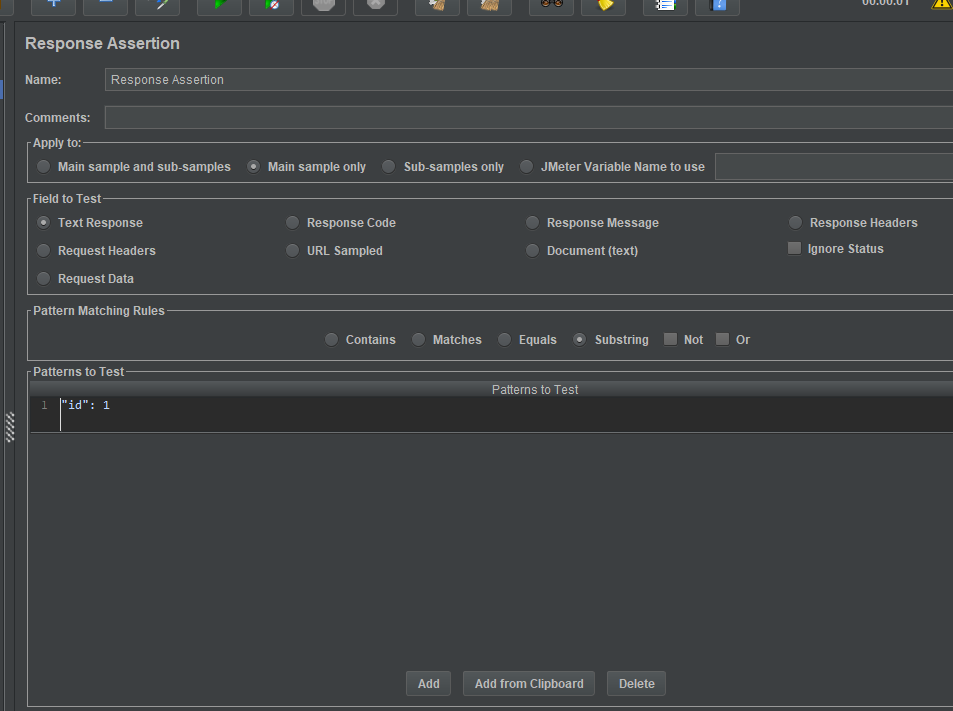
Right-click your HTTP Sampler on the left side and choose Add > Assertions > Response Assertion. Under “Field to Test”, choose “Text Response”. Under “Pattern Matching Rules”, choose “Substring”. Under “Patterns to Test”, click “Add”. Then in the pattern field that appears, enter "id": 1.
Now click the “cog and broom” icon from the command ribbon, or select Run > Clear from the top menu. This will clear the results of your earlier test run from the View Results Tree block. And finally, run your test again. If you check your Results Tree, you should see that the HTTP request ran, and the green check mark means all assertions passed.
Some configuration
Let’s make our test a little more configurable. We want to be able to pass in parameters at run time so we can run the same test in multiple environments.
Add a text file named “production.properties” to your config/ folder. Paste the following into it:
Protocol=https
Port=
Server=jsonplaceholder.typicode.com
Path=/posts/1
This is a flat configuration file: variable names on the left, string values on the right. Now let’s set up our test to use this file if we pass it in.
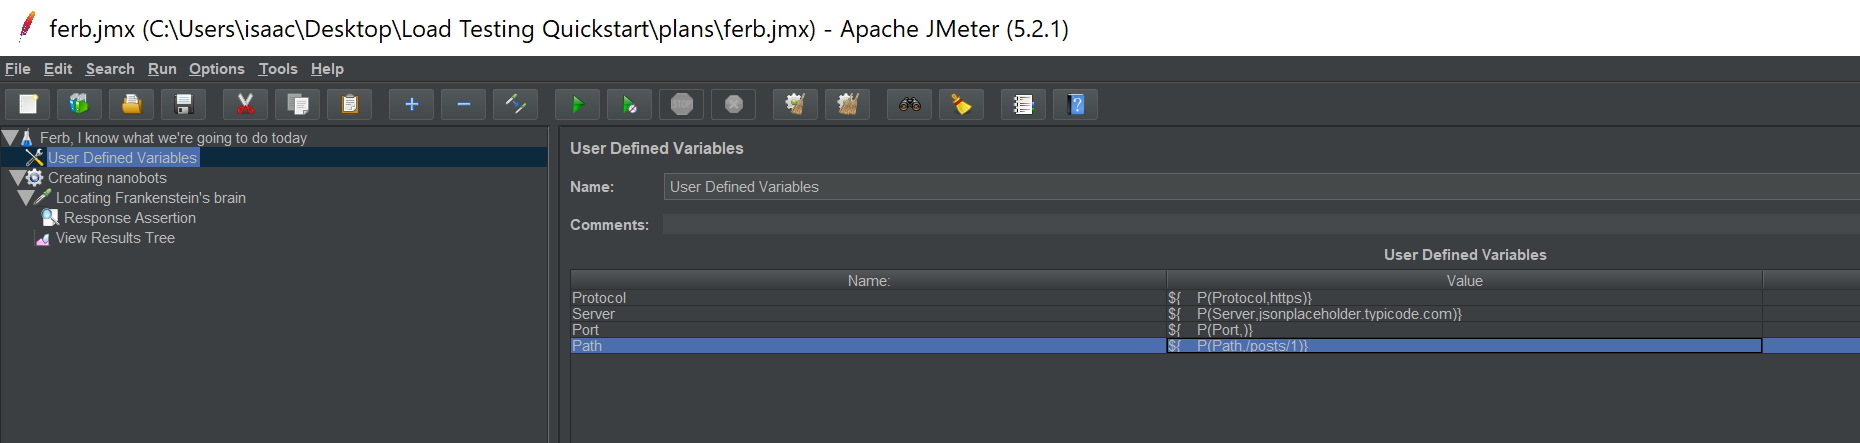
In the JMeter GUI, right-click your test plan on the left side and select Add > Config Element > User Defined Variables. Then drag the User Defined Variables item up so it sits right underneath the test plan. Go ahead and select the User Defined Variables block. We’ll be using the “Add” button at the bottom of the block to add some variables.
If we didn’t want to use our external production.properties file to set values, we could set up our variables like this:
| Variable | Value |
|---|---|
| Protocol | https |
| Port | |
| Server | jsonplaceholder.typicode.com |
| Path | /posts/1 |
But we’re making our test configurable, so instead we’ll define our variables like this:
| Variable | Value |
|---|---|
| Protocol | ${__P(Protocol,https)} |
| Port | ${__P(Port,)} |
| Server | ${__P(Server,jsonplaceholder.typicode.com)} |
| Path | ${__P(Path,/posts/1)} |
In JMeter, you can use ${ } almost anywhere to pull in a variable or function. And the __P(propertyName,defaultValue) function pulls in a property (like the ones in our properties file) using the first argument, or falls back to the second argument if it can’t find that property. That is, when JMeter wants to use the Protocol variable, it will look for a property named Protocol, and if it can’t find it, it will set the Protocol variable to "https". Properties and variables are different things and they don’t have to have the same names—I’ve just used identical names here for simplicity.
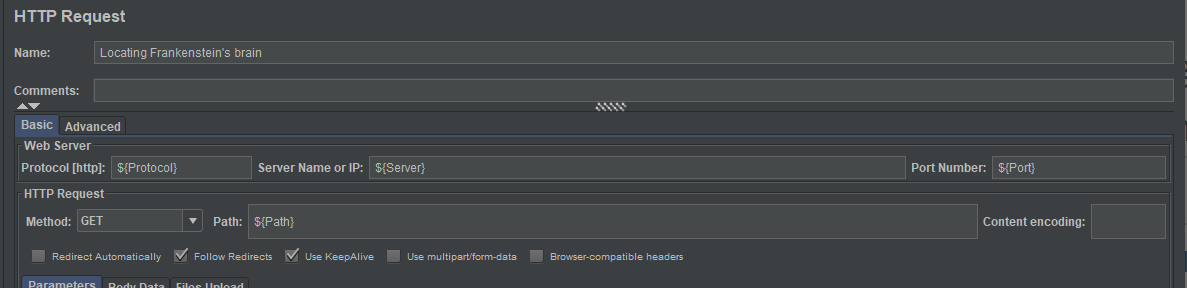
Next, select your HTTP Request block. Set Protocol to ${Protocol}, Server Name to ${Server}, Port Number to ${Port}, and Path to ${Path}. If you run the test again, it should run just the same as it did last time.
To run your test using your .properties file, you’ll do something like the following from the command line:
Windows:
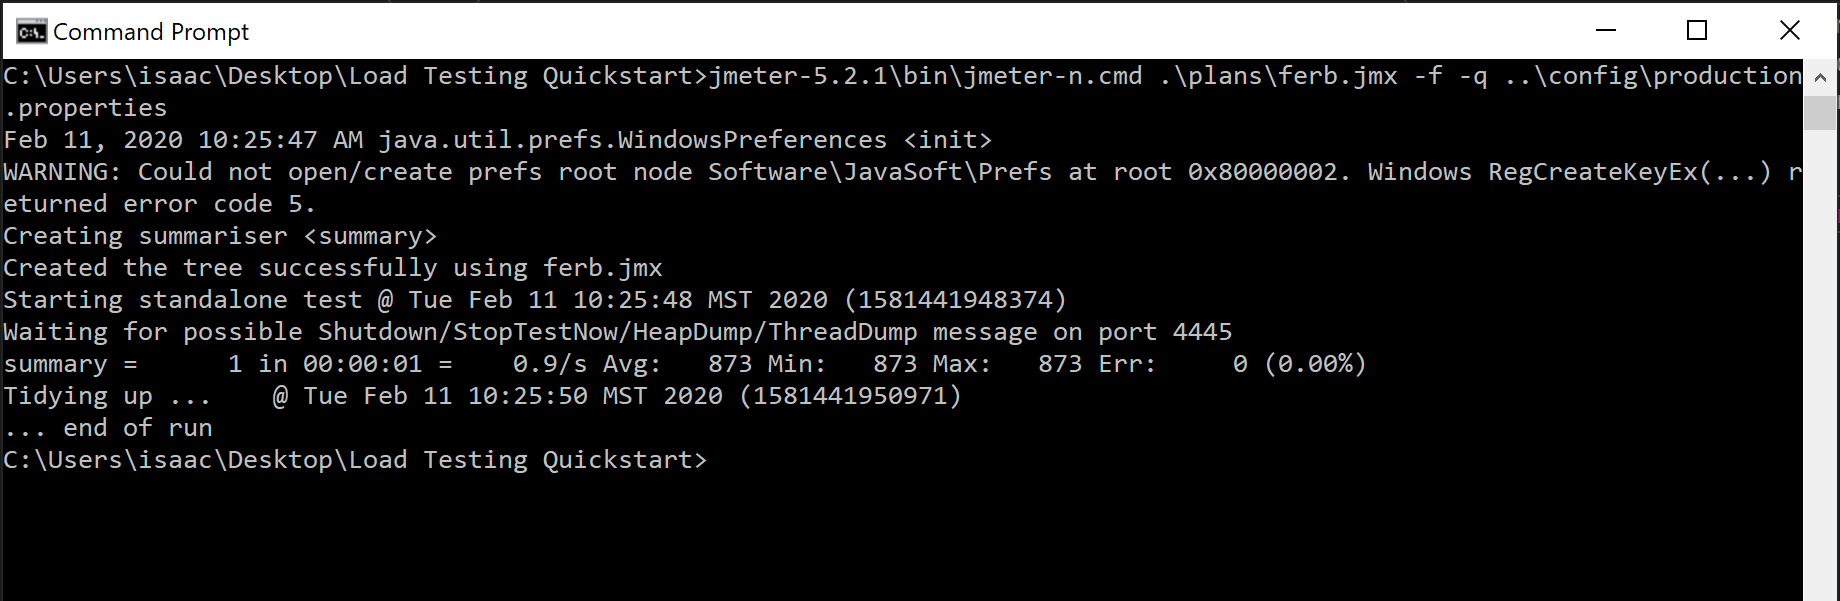
C:\Load Testing Quickstart> jmeter-5.2.1\bin\jmeter-n.cmd .\plans\ferb.jmx -f -q ..\config\production.properties
Linux (untested):
usr/username/Load Testing Quickstart $ ./jmeter-5.2.1/bin/jmeter -n -t ./plans/ferb.jmx -f -q ../config/production.properties
When you run JMeter in CLI mode on Windows, the first argument should be the JMX file that contains your test plan. The -f flag lets JMeter overwrite the results of previous test runs. The -q flag lets you pass in a properties file like the one we created earlier (the path is relative to the JMX file). For more info on CLI flags, see the documentation. You should see something like the following:
And now there will be two new files in your plans/ folder:
ferb.jtl- A CSV file with high-level test results. (I recommend changing the extension to.csvand opening this in Excel.)ferb.log- A text log file with the complete output of the test. (You can open this in a regular text editor.)
Reacting to response data
Another common situation is when you need to set a variable based on the response data from an HTTP request (this is very useful when you need to log in and use an auth token on future API requests).
To do this, right-click your HTTP Sampler and choose Add > Post Processors > Regular Expression Extractor. Do a bit of configuring, and you’ll be able to set a variable from the response body:
- “Name of created variable”: The variable name you want to set (e.g.
PostId). - “Regular Expression”: A regular expression with one or more capture groups for the data you want to retrieve (e.g.
"id": ([0-9]+)) - “Template”: A string template for setting the value of the variable, where capture groups are inserted by number (e.g.
$1$to use the first or only capture group as the value of the variable). - “Match No.”: If the regular expression has more than one match, which match should be used (e.g.
1). - “Default Value”: What to set the variable to if there are no matches.
If you used the examples above, you can use ${PostId} throughout the rest of your test to refer to the value you captured.
Think times
Usually a load test will include several HTTP requests, but it isn’t necessarily realistic for each simulated user to send each request at exactly the same time, one after another, unless your users are a robot army with a hive mind. You can add a random amount of “thinking time” between each step by right-clicking your Thread Group and choosing “Add Think Times to children”. An action called “Think Time” will be added between each step in your test; if you expand it, you’ll see a timer called “Pause”.
The Pause block has two values: a Constant Delay Offset and a Random Delay Maximum. Whenever a thread reaches one of those Pause steps, it will pause for a random number of milliseconds, at least equal to Constant Delay Offset and at most equal to Constant Delay Offset + Random Delay Maximum. This way, your threads will end up somewhat staggered and all send requests at slightly different times, more like real users.
What else can JMeter do?
JMeter has a lot of cool features. Hopefully some of them have caught your eye already while you’ve followed this tutorial. Here are some examples:
- Logic Controllers (While and If): You can loop over parts of your test plan or skip them altogether based on the value of a variable, just like
whileandifstatements in code. - Custom scripts: JMeter understands JavaScript, Groovy, and BeanShell, so you can write custom scripts to help with your test logic.
- HTTP Cookie and Header Managers: JMeter can easily set up any cookies and headers you want to use on your HTTP requests, with any variables you want to provide.
- Debug Sampler: If you want to see the values of properties or variables at any time in your test, you can add a Debug Sampler and a complete list will show up in your Results Tree.
- JSON and XML traversal: I’ve used regular expressions throughout this tutorial, but JMeter can also make assertions and extract data from HTTP responses by traversing a JSON or XML tree.
- So much more: I’m still pretty new to JMeter and I’m discovering new things all the time…if I missed your favorite JMeter feature, let me know!
Good luck!